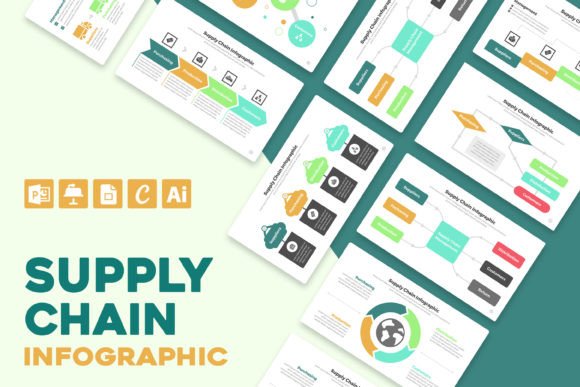
Visualize Your Logistics: Supply Chain Infographic Templates
Managing a supply chain is rarely a straight line. It is a complex web of vendors, logistics providers, manufacturers, and retailers. If you have ever struggled to explain the flow of goods to a stakeholder or felt overwhelmed by spreadsheets, you are not alone. Keeping track of every moving part requires more than just data; it requires clarity. This is where high-quality Supply Chain Infographic Templates become an essential tool for modern professionals. They transform raw, complicated data into a visual narrative that everyone can understand instantly.
Why Visualizing Logistics Matters
Humans are visual creatures. We process visual information significantly faster than text. When you are dealing with global shipping routes, inventory levels, and procurement cycles, a wall of text or a dense spreadsheet can obscure the critical insights you need. Supply Chain Infographic Templates bridge the gap between complex operations and clear communication. They allow you to map out the entire lifecycle of a product, from raw material sourcing to the final delivery at the customer's doorstep.
The specific template we are discussing here goes beyond simple flowcharts. It creates a powerful image of the industry by highlighting the diverse people involved. As noted in the design overview, these visuals demonstrate the huge range of individuals who make the chain work. By assigning numbers to different roles and explaining their functions, the template humanizes the process. It moves away from abstract boxes and arrows, showing instead how real people collaborate, share best practices, and drive the industry forward.
Key Features of a Professional Template
Not all design assets are created equal. A subpar template can actually waste time if it is difficult to edit or uses incompatible formats. The strength of these specific Supply Chain Infographic Templates lies in their professional, clean design and universal compatibility. Whether you are a freelancer working in Google Slides or a corporate manager using PowerPoint, these files integrate seamlessly into your existing workflow.
Here is what makes this particular set stand out:
- Instant Download: Time is money in logistics. You get immediate access to the files after purchase, allowing you to start working immediately.
- Multi-Platform Compatibility: The package includes PowerPoint PPTX, Google Slides, Apple Keynote, and Adobe Illustrator EPS. This ensures you are covered regardless of your preferred software.
- 100% Editable Elements: You have full control over colors, text, and shapes. This allows you to tailor the solution to fit your company’s specific branding and needs.
- Professional Aesthetics: The designs use free fonts and maintain a clean, corporate look that commands respect in boardrooms and classrooms alike.
Practical Applications for Business and Education
The utility of Supply Chain Infographic Templates extends across various sectors. For business owners and entrepreneurs, these templates are invaluable during investor pitches. Instead of describing your distribution network verbally, you can show a polished graphic that demonstrates your operational efficiency and scalability. It provides a tailored solution to fit your company’s needs, whether you are in e-commerce, manufacturing, or retail.
Marketers and bloggers can use these templates to create engaging content. Supply chain issues are frequently in the news. By using an infographic to explain a current event or a "behind the scenes" look at your product's journey, you create content that is highly shareable. It adds value to your blog posts and social media feeds, positioning you as an industry expert.
In educational settings, these tools are equally powerful. Teachers and corporate trainers can use them to explain complex logistics concepts to students or new hires. The visual representation of roles—showing how people work and create products—helps learners grasp the interconnected nature of global trade much faster than a textbook diagram could.
Enhancing Communication and Efficiency
One of the biggest challenges in supply chain management is communication breakdown. When different departments (procurement, warehousing, shipping) use different terminology or data silos, mistakes happen. A standardized visual template acts as a universal language. It ensures that everyone, from the warehouse floor to the C-suite, is looking at the same picture.
Using Supply Chain Infographic Templates also boosts productivity. Creating a high-quality graphic from scratch takes hours, even for a skilled designer. By using a pre-made, editable template, you can produce professional materials in minutes. This efficiency allows you to focus on analyzing the data rather than formatting the boxes around it. It is a practical way to maintain high standards of reporting without burning out your creative resources.
Choosing the Right Template for Your Needs
When selecting a template, consider the specific story you need to tell. Do you need to map out a specific process, or do you need a high-level overview of the entire industry? Look for designs that offer flexibility. The inclusion of a Help File Documentation is a significant plus, as it guides you through the editing process, ensuring you can maximize the tool's potential.
Furthermore, pay attention to the design language. The best Supply Chain Infographic Templates balance data density with white space. They should be detailed enough to be informative but clean enough to be readable at a glance. Since this template focuses on the human element—showing why people work so hard and collaborate—it is particularly well-suited for companies that value their internal culture and want to highlight team dynamics alongside operational metrics.
Ultimately, the goal is to simplify the complex. By investing in high-quality visual assets, you equip yourself with the tools to lead, educate, and inspire. Whether you are tracking inventory, planning a global rollout, or teaching a class, these templates provide the structure you need to present your information with authority and clarity.