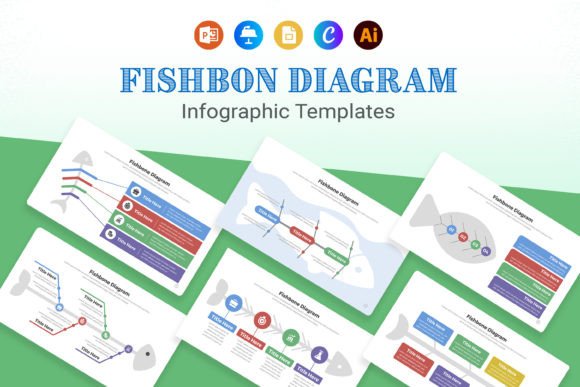
Mastering Visual Problem-Solving with Fishbone Diagram Infographic Templates
In a world saturated with data and complex challenges, the ability to distill intricate processes and root causes into a clear, visual narrative is no longer a luxury—it's a fundamental business and communication skill. The Fishbone Diagram, also known as the Ishikawa or Cause and Effect diagram, has long been a staple in quality management and process improvement. Today, its power is being amplified through accessible Fishbone Diagram Infographic Templates, transforming this analytical tool into a dynamic medium for storytelling, education, and strategic alignment across every industry.
From Static Analysis to Dynamic Storytelling
Traditionally confined to whiteboards and dense reports, the Fishbone Diagram's core function is to systematically identify potential root causes of a specific effect or problem. The "head" of the fish represents the problem, and the "bones" represent categories of potential causes. While effective, this format often remained internal and technical. The evolution into infographic templates marks a significant shift. It acknowledges that the insight derived from the analysis is often as valuable as the solution itself—and that insight must be communicated compellingly to stakeholders, teams, and audiences who may not be subject matter experts.
This shift aligns perfectly with modern workflow expectations. We operate in environments that value transparency, collaborative problem-solving, and rapid iteration. A well-designed fishbone infographic allows a project manager to visually map out the factors leading to a delayed product launch, a marketing team to deconstruct the elements of a successful campaign, or a healthcare administrator to illustrate the chain of events impacting patient wait times. It turns abstract analysis into a shared, visual language that facilitates faster consensus and more informed decision-making.
The Practical Power of Editable Templates
The true catalyst for this widespread adoption is the accessibility provided by Fishbone Diagram Infographic Templates. The barriers to creating professional, clear, and engaging visual assets have dramatically lowered. These templates are not just static images; they are frameworks built for customization and collaboration. The practical implications are profound for professionals of all types.
- For Educators and Trainers: Move beyond theoretical explanations. A biology teacher can use a fishbone template to visually break down the factors affecting an ecosystem's health. A corporate trainer can map out the causes of workplace safety incidents, making the training session interactive and memorable.
- For Marketers and Sales Teams: Transform a sales pitch or a campaign post-mortem. Instead of bullet points on a slide, present the interconnected factors that led to a 20% increase in lead generation, or diagnose the reasons behind a product's market reception. This visual approach is more persuasive and easier for clients to grasp.
- For Entrepreneurs and Startup Founders: In the lean startup environment, rapid diagnosis is key. A fishbone infographic can help visually articulate a core business challenge to co-founders, advisors, or early investors. It demonstrates a structured, analytical approach to problem-solving, which builds credibility.
- For Project Managers and Team Leads: Facilitate more effective retrospectives and root-cause analysis sessions. A shared, editable fishbone diagram becomes a collaborative canvas where the entire team can contribute, categorize, and prioritize issues in real-time, whether in the same room or across time zones.
The key features that enable this practicality are instant download for immediate project kickoff, professional design that ensures credibility, and 100% editability in common platforms like PowerPoint, Google Slides, and Adobe Illustrator. This means a template isn't a final product but a starting point—a professionally designed skeleton that you infuse with your specific data, brand colors, and narrative.
Fitting into the Visual Communication Trend
The demand for these templates is fueled by a broader, irreversible trend: the dominance of visual communication. Data from content marketing studies consistently shows that infographics are among the most shared and engaging content formats. Our brains process visual information 60,000 times faster than text. In an era of information overload, a clear fishbone diagram cuts through the noise. It answers the "why" and "how" in a single, scannable format.
Furthermore, the rise of remote and hybrid work has intensified the need for clear, asynchronous communication tools. A fishbone infographic shared in a project management tool or via email can convey complex project status or problem analysis without requiring a synchronous meeting. It serves as a persistent, visual record that team members can reference, comment on, and update, aligning with the modern expectation for flexible, documented workflows.
Observations and Recommendations for Effective Use
While the template provides the structure, the value lies in its application. Here are grounded recommendations for leveraging a Fishbone Diagram Infographic Template effectively:
- Start with a Precise "Head": The problem or effect you are analyzing must be specific and measurable. "Improve sales" is too vague. "Reduce sales cycle length from 45 to 30 days for Product X" is a clear target for analysis.
- Choose Meaningful "Bones": The standard categories (Methods, Machines, People, Materials, Environment, Measurement) are a starting point. Customize them to your context. For a software bug, your categories might be Code, Infrastructure, User Input, and Third-Party Services.
- Focus on Causes, Not Solutions: The diagram's initial purpose is to map potential causes. Brainstorming solutions comes after the analysis is complete. This discipline prevents jumping to conclusions and ensures a thorough investigation.
- Make it a Collaborative Artifact: The editable nature of the template is its greatest strength. Use it in a live session (virtual or in-person) where team members can add their insights directly to the shared file. This builds collective ownership of both the problem and the eventual solution.
- Iterate and Update: A fishbone diagram is not a one-time exercise. As you test hypotheses and gather more data, return to the infographic to mark off disproven causes or highlight validated ones. This turns it into a living document of your problem-solving journey.
In conclusion, Fishbone Diagram Infographic Templates represent more than just a pretty chart. They are a bridge between rigorous analytical thinking and the imperative for clear, visual storytelling. By providing an accessible, professional, and flexible framework, they empower individuals and teams across all sectors to diagnose problems more effectively, communicate insights more persuasively, and ultimately drive better outcomes. Whether you are dissecting a business challenge, teaching a complex concept, or planning a strategic initiative, grabbing a template is the first step toward transforming intricate cause-and-effect relationships into compelling visual narratives.