Matrix Infographic Templates: A Practical Framework for Visual Communication
Integrating Visual Strategy into Your Workflow
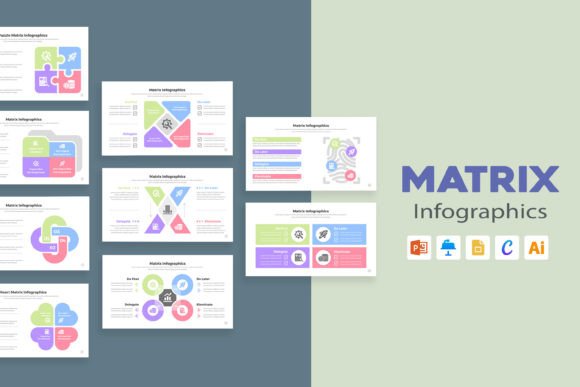
In the modern content landscape, the ability to synthesize complex data into a digestible format is not just a design preference—it is a functional necessity. Whether you are a project manager mapping dependencies or a marketing strategist analyzing competitive positioning, the "Matrix" format offers a powerful visual language. Introducing our newest set of Matrix Infographic Templates, designed specifically to bridge the gap between raw data and audience comprehension. These templates are not merely decorative assets; they are functional tools intended to streamline your planning and execution phases.
The challenge many professionals face is not a lack of information, but rather the friction involved in visualizing it. Starting from a blank canvas in Adobe Illustrator or PowerPoint often leads to wasted hours adjusting grid lines and aligning text boxes. By leveraging a pre-structured template, you bypass the architectural phase of design and move immediately to the strategic phase: deciding what information belongs in the matrix and how it influences your next decision.
The Mechanics of the Matrix Format
A matrix is essentially a decision-making and analysis tool. It allows you to plot variables against one another to reveal relationships, hierarchies, and gaps. In a business context, this is most commonly seen in the Ansoff Matrix, the BCG Matrix, or the Eisenhower Decision Matrix. However, the utility of this visual format extends far beyond standard business theory.
Consider the following practical applications where a Matrix Infographic Template fits naturally into a workflow:
- Project Prioritization: Use a quadrant chart to plot tasks based on "Effort" vs. "Impact." This helps teams visualize which quick wins to tackle immediately and which high-effort projects require more planning.
- Resource Allocation: For HR professionals and team leads, a matrix can map team members' skills against project requirements, identifying gaps in capability before a project begins.
- Content Strategy: Marketers can use a 2x2 grid to categorize content themes based on audience awareness and product relevance, ensuring a balanced editorial calendar.
- Product Comparison: Retailers and affiliate marketers can create comparison infographics that stack features against price points, aiding the consumer decision-making process.
Seamless Integration Across Platforms
One of the primary barriers to effective workflow integration is software compatibility. A template is only useful if it works within your existing ecosystem. This collection of Matrix Infographic Templates addresses that friction point through broad compatibility. The files are delivered in PowerPoint PPTX, Google Slides, Apple Keynote, and Adobe Illustrator formats.
This versatility allows for distinct workflow paths depending on your role:
For the Collaborative Team
If your workflow relies on real-time collaboration, the Google Slides version is ideal. You can share the matrix with stakeholders, allow them to edit specific data points, and finalize the design without exporting files back and forth. This is particularly useful during the "during" phase of a project, where rapid iteration is required based on team feedback.
For the Solo Creator and Designer
Freelancers and graphic designers often prefer Adobe Illustrator for its granular control over vector paths and typography. Using the template here allows for the highest level of customization, ensuring the final output matches a client's specific brand guidelines perfectly. The use of free fonts ensures that you will not encounter licensing issues or missing font errors when opening the files on different machines.
For the Corporate Environment
In many enterprise environments, PowerPoint remains the standard. The PPTX format ensures that you can drop the infographic directly into a larger corporate deck or pitch presentation. Because the templates are 100% editable, you can easily adjust the color palette to match corporate hex codes, maintaining brand consistency across all internal and external communications.
Optimizing the Design Process
Efficiency in design is about removing repetitive tasks. When you download the Matrix Infographic Templates, you are acquiring a "pre-flight" asset. You have already solved the problems of hierarchy, spacing, and color contrast. Now, your focus shifts to content population.
To maximize the value of these templates, consider the following implementation tips:
- Define Your Variables First: Before opening the file, determine what your X and Y axes represent. If you are creating a SWOT analysis, clearly define the internal vs. external factors. If you are creating a risk matrix, define the probability vs. severity scales.
- Data Hierarchy: Use the bold and italic formatting options within the template to differentiate between headers, sub-headers, and body text. This ensures that the viewer's eye is guided naturally from the title to the most critical data points.
- Color Coding for Clarity: Use color not just for aesthetics, but for function. For example, in a traffic-light system matrix, use green for "Go/High Priority," yellow for "Review," and red for "Stop/Low Priority." This provides instant visual context without requiring the viewer to read every label.
- Export Strategy: Once the design is finalized, consider how it will be consumed. If it is for a blog post, export as a high-resolution PNG or JPEG. If it is for a print handout, ensure your export settings are configured for 300 DPI.
Consistency and Quality Control
Brand recognition relies heavily on consistency. When you use a standardized template library, you create a visual thread that runs through all your publications. Whether you are publishing a white paper, a social media carousel, or a quarterly report, using the same stylistic language (typography, iconography, and grid structure) builds trust with your audience.
Furthermore, these templates assist in quality control. Because the layout is pre-designed, you reduce the risk of alignment errors or inconsistent spacing that can make a finished product look unprofessional. The "Professional, clean design" ensures that the visual container does not distract from the content itself—a crucial element for educators and corporate trainers who need the information to be the focal point.
Long-Term Usability and Scalability
A template should be a long-term asset, not a one-time use item. The structure of these Matrix Infographic Templates allows for scalability. You can reuse the same quadrant layout for different quarterly reports simply by swapping out the data and the specific icons. This approach saves significant time over the fiscal year.
Moreover, because the templates utilize standard layout grids, they are easily adaptable to different aspect ratios if needed. While they are optimized for standard presentation and document sizes, the editable nature of the files means you can reformat them for vertical infographics or wide-screen displays with minimal effort.
Conclusion
Effective communication is about clarity, and the Matrix Infographic Template provides the structure necessary to achieve it. By integrating these templates into your workflow, you move beyond simply "making slides" and toward a more strategic approach to visual data presentation. Whether you are analyzing market trends, planning a project sprint, or organizing educational content, this resource offers a practical, efficient, and high-quality solution for your visual communication needs. Grab your copy today to streamline your next project and ensure your data tells a clear, compelling story.